Saturday, May 23, 2020

Cloverland Leagues: 22 May Update


Friday was an off-day, so it's time for another update.

I was actually thinking I wanted another update anyhow, and hadn't quite gotten around to one in the last 2-3 days. Taking a Doylist look at things, the runs per game (and home runs) are rather too high. I'm not sure if it's one problem or two different ones. It's worse in the AL than the NL, which maybe is DH-related? Not sure. I think there are also too many strikeouts.

In any case, let's just pull out a few players. We're very close to one-third of the way through the season. David Cone is 4-4 with a 5.35 ERA (which is actually good for a 106 ERA+) and 12.7 K/9. In the real 1998, his ERA+ was 125. It's not unreasonable to think he'd suffer when facing stiffer competition in a league of all-time greats. His real 1998 K/9 was 9.1, though. So he's striking out more than 33% more batters.  Kevin Millwood of Atlanta is 4-3 with an ERA+ of 92 and 12.6 K/9. His ERA+ in real 1998 was 102 and he had 8.4 K/9. Once again, he's striking out more people in this all-time league than in real life.  Turning to batters, Ichiro is hitting .398 with an OPS+ of 132 and a 16-HR pace. In real 2001 he had an OPS+ of 126 and 8 home runs. So, against all-time pitching staffs he's doing better than he did when he got to face a bunch of terrible staffs a bunch of times a year.  I could go on, but you get the point. Maybe this is something I could go in and tweak (or could have gone in and tweaked) before starting the league, but so it goes. Maybe this is why the MLB-sponsored  games are tournaments rather than full seasons--it works for seasons with a reasonable distribution of talent but not what I'm doing.  In any case, it's perfectly fun and there's no real ground truth, so that's all fine. But I don't think it's "realistic" inasmuch as we can reasonably form expectations.

Anyway.

We've now got 48 games played, putting us close to 1/3 of the way. Here are the current standings:


Basically, the AL remains very close and the NL still looks pretty settled. In the AL Northeast, Boston and Cleveland have more or less maintained their previous pace while the Yankees went 8-4 to gain a share of first place. The Yankees' stretch included a frustrating sweep by the Angels where they were outscored 43-14 and had a bench-clearing brawl with the Angels in a game that was mercifully cut short by rain. Minnesota's mediocre 6-6 run was enough to let them gain sole possession of the AL Central, as the other teams have been playing abysmally badly (the Tigers and Brewers were 4-8, the White Sox 3-9). In the AL Southeast the standings have been kind of static, but the teams have (mostly) been playing well: Texas and Tampa Bay at 8-4 and Houston at 7-5. On the other hand, Baltimore had the worst stretch of any team in either league at 2-10. In the AL West, Seattle and Oakland inched closer to Kansas City but it was the Angels who had the best stretch at 8-4 during a difficult run of games (the Yankees, Red Sox, Blues, and Rays).

Over in the NL, the story seems to be that the teams in the drivers seats are still more or less there: Pittsburgh, Atlanta, and the Dodgers all extended their division leads. However, there does appear to be some action in the NL Central.  St. Louis' lead has shrunk from 4 games to 2. They've played OK at 7-5 in the most recent 12-game stretch (the same as the Dodgers), but the Reds have been playing much better of late: 10-2 in the last 12 and with an overall Pythagorean record that would put them 1st in the division. I'd suspected they'd do well, so the question will be whether they can sustain this over the next stretch--it starts relatively easily against Florida and San Francisco before they host the juggernaut Atlanta team.

Turning to the individual statistics: The overall leader in batting is Manny Sanguillen at .416 and Eric Aybar leads the AL at .399.  The leaders last time have cooled, with Bregman down to .390 and Clemente at .379. Bregman and Chipper Jones still lead their leagues in WAR, both by a significant margin. Pat Burrell has taken over the lead in the HR race, with 8 in the last 12 games and 11 in the last 15 games. Even that is not quite as hot as George Foster, who has 12 HR and 27 RBI in the last 14 games. Stargell leads the NL in HR with 20 to Foster's 19. 5 AL players have between 59-62 RBI, with Bret Boone leading the way. Matt Adams of the Cardinals leads the NL with 53.

As noted above, the NL seems to be a lower run scoring environment, or has better pitching, or something. So as you'd expect most of the pitching leaders are in the NL.  Kevin Brown of the Marlins lowered his ERA to 1.20 since last time, giving up 1 run in 18 innings. John Smoltz also has his ERA down under 2.00 now. Jack McDowell leads the AL in ERA with 2.27 after a couple of nice starts including a 1-hit shutout of the Twins. Don Gullett and Garret Richards both have 8 wins to lead the majors (and their leagues). Kevin Brown of the Padres is now at 3.8 pitching WAR, with Smoltz not too far behind at 3.6. Meanwhile, the Randy Johnson strikeout parade continues, he's up to 163 after striking out 36 in 16 innings including tying his all-time record with another 21-K game.

That's all for now, see you at @CloverlandLeag1 on Twitter! 

Sunday, May 10, 2020

Cloverland Leagues: 10 May Update


It's another off-day! Time for another update.

We're twelve games further in, with each team having played 36 games. I'm not crazy about the schedule, to be honest--every team plays a bunch of games in a row, kind of in lockstep. I feel like it might really end up wreaking havoc on some pitching staffs, though maybe the AI can handle it since OOTP is pretty well established? In any case, with just a 150-game schedule, we're nearly 1/4 done!

Here are the current standings:


The Red Sox' winning streak ended just after the last update, and they lost 2 of 3 to the Yankees, were swept by Oakland, and lost 2 of 3 to Detroit (though they won a series with Oakland). New York (7-5 since last time) and Cleveland (8-4 since last time) have made up most of the deficit. Between now and the next off-day update (22 May), Boston will play Seattle, Milwaukee, Baltimore, and LA, the Yankees play most of those same teams (playing Toronto instead of just-visited Seattle), and Cleveland faces LA, Toronto, Houston, and Kansas City.

Over in the AL Central, the White Sox went 8-4 to take over the division lead, sweeping Baltimore and taking 2 of 3 from Milwaukee and LA before losing a series to Toronto. They're within shouting distance of .500, the only division leader below that mark. Milwaukee had a disastrous stretch, going just 2-10 and are now tied for the worst record in this simulation.

The AL Southeast has remained more or less static. Tampa Bay and Houston went 7-5 and narrowed the gap between them and Texas to 1 game. Baltimore had a very difficult stretch and dropped to 5 games back. But none of these teams strike me as out of it.  Texas' schedule next has them playing Detroit, Seattle, Milwaukee, and Baltimore. Tampa Bay will play Baltimore, LA, Toronto, and Houston, while Houston faces Chicago, Minnesota, and Cleveland before the showdown in Tampa Bay.

Kansas City remains in first place in the AL West, slightly enlarging their lead after a 7-5 run. However, second place now belongs to Seattle, who swept Minnesota and won series with Tampa Bay and the Yankees (while losing a series to Cleveland) to go 8-4. Oakland also went 8-4, and has taken over 3rd.

The story in the NL is more of good teams extending leads. The largest divisional lead in the AL is 3 games (Kansas City in the AL West), while the smallest divisional lead in the NL is 4 games (St. Louis in the NL Central). Pittsburgh went 8-4, St. Louis went 9-3, Atlanta went 10-2, and the Dodgers went 9-3. On the flip side of this, Montreal, Colorado, Charlotte, and the Mets went 3-9, and Arizona and the Giants went 4-8.  Atlanta had a 13-game winning streak, which was snapped by Pittsburgh in a showdown of the league's best teams (Atlanta won the series). St. Louis has the longest active winning streak at 8, Charlotte owns the longest active losing streak at 6.

Looking at the statistical leaders, Alex Bregman has been very hot, and now leads the AL in batting at .429 and WAR at 3.3. Roberto Clemente is at .414 to lead the NL in batting average, Chipper Jones has a WAR of 2.5 to lead th eNL. George Brett remains the AL home run leader at 17 despite only hitting 2 in the last 12 games--Pat Burrell and Darryl Strawberry (Yankees edition) are just behind him at 16. Cody Bellinger leads the NL with 15.   Brett continues to drive in runs, however, with 18 in 12 games to maintain his RBI lead with 15. Matt Holliday of the Rockies leads the NL with 43.  Brett's RBI pace remains close to where it was (229 on the season), though his home run pace is down to "only" 71 (in a 150-game season, though)...

The pitching leaders include Kevin Brown of the Marlins, who has a 1.63 ERA, Kevin Brown of the Padres, who has 2.8 pitching WAR, several folks tied with 6 wins (Don Gullett is the only NL player among them, though), and Randy Johnson maintaining an insane strikeout pace, now at 127 for the season and averaging 19.1 K/9. That puts him on a pace to strike out 529 people on the season.

Thanks again for reading, and you can get daily scores and highlights on the league Twitter feed at @CloverlandLeag1, which I retweet at my personal feed at @asrivkin.


Sunday, April 26, 2020

Cloverland Leagues: 26 April Update


Today's an off-day, so it seems like a particularly good time for an update. I was due to post one anyhow. :)

Since the last update, Boston has been absolutely on fire, going 12-1 with all 12 of those wins in a still-active streak. Here--let me post the standings:


Boston going 12-1 combined with Cleveland scuffling and the Yankees treading water has put the Red Sox in excellent shape. Of course, we're still in April.  Elsewhere, the standings haven't shuffled too much--the best teams last time (Pirates, Atlanta) have continued to play well, the teams struggling last time (San Diego, the entire AL Central) have continued to struggle.  I will call out Charlotte as hanging in there, taking 2 of 3 from Atlanta and Arizona before getting swept by the Pirates just before this post.

Boston's streak has been built on sweeps of the White Sox, Twins, Blues, and Rays. Of these teams only Tampa has a winning record, but it's early enough that that may be tautological. Their next three series are against the Yankees, A's, and Rangers, the first and last of which are playing well.  Beyond Boston, the Mets have also turned it on, with 8 wins out of the last 9 as they swept Colorado and Chicago and took 3 of 4 from the Reds.

Looking at individual statistics, Chipper Jones continues to lead the NL in batting but has "cooled off" to only .414. Meanwhile, Carlos Correa has been on an amazing hot streak (do I hear trash cans getting banged?) and is batting .453 on the season--.650 with 13 hits in the past week.  As far as the other Triple Crown stats, George Brett has 15 HR and 37 RBI. Ichiro Suzuki has a 23-game hitting streak active. Sid Fernandez has a 1.26 ERA on the season, several folks have 4 pitching wins at this point. Randy Johnson has an astonishing 81 Ks in 39 innings pitched (yet he's only 3-2). Johnson is now on pace for "only" 506 Ks. The projected batting records have also come down, though are still way above record pace--Brett is on pace for 94 HR and 231 RBI.

As a bit of a reality check on things, the league is averaging 5.4 runs per team per game. In 2019 the real number was 4.83, and only once in history was the number as high as 5.4 (it was 5.5 in 1930). So my expectation of a high-scoring league is being met as of right now. Again, it could settle down...

Sunday, April 12, 2020

Cloverland Leagues: 12 April Update


It's the second Sunday of the Cloverland Leagues season. I'm going to try two different ways to post updates--first, I've made a Twitter account (@CloverlandLeag1) where I've been posting daily scores and performances of note. I'm also planning to do weekly, broader updates here. Knowing how I am, it'll probably be a mix of in-game and real-life perspectives, but I'll try to keep them separate. :)

The game itself has been running fine, though I did have to replay one day a few times because it kept crashing. Frustratingly, it would crash after playing that day's games, so it in theory had an affect on the final results--when I resolved things, the Yankees had definitely lost a game that they won the previous 3 times they played. But so it goes.  I'd been anticipating an unrealistically good year for the hitters, and I think in the early going that's being borne out. I can almost see why that might happen--every team has great hitters (these are [almost] all historically-great teams),  but even the best teams have some so-so starters. So, great lineups are hitting every day, sometimes against iffy pitchers. However, there are also ridiculous performances by pitchers on occasion--Randy Johnson struck out 21 on Opening Day against the 1976 Philadelphia Phillies. Since the single-game record is 20, Johnson's performance seems...dubious.  But it's fun, which is all we can ask for.

Standings:


It's obviously early, but I suppose it's also pushing 10% of the way into the season. I'm not sure how seriously to take performances so far, especially since the only games I've seen are the Yankees games. If I had to guess, though, I guess I'd believe the Pirates and Atlanta are "real", and that the Angels aren't.  I also find it hard to believe that Cincinnati, the Mets, and Yankees will finish under .500. We'll see.

Obviously, individual statistics and leaders are also (presumably) not (necessarily) where they'll end up, but for the record Chipper Jones is leading the NL with a .476 average (Michael Young leads the AL at .465), Hanley Ramirez of your Charlotte Knights leads the NL with 8 HR so far (Bogaerts, Brett, and Kepler have 7 to co-lead the AL), George Brett leads the AL with 21 RBI (Richie Hebner has 19 for the NL), and Richie Hebner has an OPS of 1.596 to lead the NL (John Olerud has 1.513 to lead the AL).

As far as pitching, Jack McDowell and Jim Palmer both have 3 wins (many folks are tied with 2), Sid Fernandez leads the NL with a 0.71 ERA (James Shields has an ERA of 1.06 to lead the AL), and Gene Garber and Joe Smith each have 5 saves and lead their respective leagues. Somehow, 11 games into the season, Kevin Brown has two shutouts and Randy Johnson has 48 Ks (in 24 innings).

Projecting over an entire season at this point is always folly, but always fun. So at this point Ramirez is on pace for 109 HR, Brett is on pace for 286 RBI, Garry Maddox is on pace for 286 hits, Edgar Renteria is on pace for 41 triples, Garber and Smith are on pace for 68 saves, Johnson is on pace for 533 strikeouts, and David Wells is on pace to give up 123 HR. All of these, needless to say, would be all-time records in real life.

On to the next week!


Tuesday, March 31, 2020

Cloverland Leagues: NL Southeast and West


OK, here's a few words about the remaining two divisions, the NL Southeast and NL West.


NL Southeast


1997 Marlins: I am not a fan of the Marlins franchise. Even having Mattingly and Jeter on board has only blunted my dislike. Still, this league needs a Marlins representative, so here they are. This was their first World Series team, from a time before they'd built up a lot of bad karma. This team could even be seen as plucky, knocking off the big Atlanta dynasty and then squeaking out a World Series win over a not-great Cleveland team. There was plenty of star power on the team, from Kevin Brown and Gary Sheffield to Bobby Bonilla and even Al Leiter!  I think this team is going to get killed.


1998 Braves: This was not only the best team of the 90's Atlanta dynasty but the best team this franchise produced in the entire 20th century. They won 106 games, and would be predicted to win 106 games. They got tripped up by San Diego (see below) in the playoffs. The famous members of the team were all there--Maddux/Glavine/Smoltz, plus this was when Kevin Millwood was one of their main pitchers. Chipper Jones and an aging Andres Galarraga led them on offense, along with a still-young Andruw Jones.


2008 "Knights":  This team needs a bit of explanation. As I said in the opening post for this season, if we took the best editions of all 30 current teams, we'd of course end up with 15 in each league in theory.  However, two teams have switched leagues in the DH era--Houston and Milwaukee. It turns out the best year for both of those teams occurred when they were members of the American League. Since it doesn't make sense to stick a DH team into a league where they can't use the DH, I put them both into the AL.  And rather than have one 16-team league and one 14-team league, I opted to add two teams to the NL--the 1994 Montreal Expos and this team, the "Charlotte Knights".  Basically, it's another Marlins team (which is ironic given how much I dislike the Marlins), pretending that they actually went through with a relocation in 2007 as they threatened. I was going to put them in Portland, but the divisions were more compact geographically if I put them in Charlotte, so here they are. The Knights are the name of Charlotte's minor league team. This was a mediocre team in real life, and by all rights they should lose 110+ games facing off against all-time greats every day. But more about that in a season preview post I plan.


2012 Nationals:  Well, here's another case where I misread and took the wrong team--both the 2014 and 2016 teams had higher Pythagorean winning percentages than this team.  Oh well.  Those teams were only a tiny amount better than this team, which has a 19-year-old Bryce Harper and Steven Strasburg just back from TJ surgery. I'll fix it next time around.


NL West


1993 Giants: Two teams tied for the best Pythagorean record in the DH era, I opted for 1993 since they had more real wins and since Barry Bonds was, well, not under a cloud. This team famously missed the playoffs although they won 103 games, and were led by Bonds, Matt Williams, and Will Clark.


1998 Padres: This Padres team won the most games in franchise history and also has the best Pythagorean record, in both cases by rather a bit. This was a pennant-winning team, led by Tony Gwynn putting in a typical Tony Gwynn season and Greg Vaughn putting in a 50-HR season (that was overshadowed by the McGwire-Sosa race).  Kevin Brown and Trevor Hoffman also show up on this team in major roles.


1999 Diamondbacks:  This team, not their World Series winner, was easily the best of the franchise. Jay Bell and Luis Gonzalez led the offense but the story was Randy Johnson and an absolutely monster year he had as a pitcher--364 Ks and an ERA of 2.48. He easily won the Cy Young Award.


2019 Dodgers: Winners of 106 games, their Pythagorean record suggests they "should" have won 107. It's always interesting to me when these franchises that have been around for ages and ages produce one of their best players or best teams just now when we're watching, but it definitely happened--this was the best team in the 60+ years the Dodgers have been in Los Angeles. Joc Pederson had a great year, but may only have been the 4th-best person in the lineup.  Cody Bellinger had a huge year, and Max Muncy and Justin Turner weren't tooo far behind.


Sunday, March 29, 2020

Cloverland Leagues: NL Northeast and Central

Though the National League has no DH (of course) and thus in principle I had more flexibility, I still decided to keep the teams to the DH era for consistency (with hobgoblins of little minds noted).  I have no doubt that the Cubs, Pirates, and Cardinals, for instance, have better representatives from the pre-1972 time period, though I think the other teams here have a decent case to be made (in many cases because the teams themselves didn't exist pre-1972.

A case could be made to rearrange these teams (and the AL teams) into chronology-based divisions. But that's not what I did, at least not this time around...

NL East


1972 Pirates: As noted in another post, I pushed the allowable time range for this team, which had the best record of any Pirates team back to 1925 and the best Pythagorean record of any Pirates team going back to 1901. Since they only missed the cutoff by a year, that seemed fair enough. However, this team, though the reigning World Series winners, couldn't beat the Reds in the NLCS.


1976 Phillies: The start of a pretty successful run for Philadelphia, which eventually resulted in a World Series winner in 1980. This edition of the Phillies won 101 games, and had the best Pythagorean record in franchise history going back to 1883. The big stars were Mike Schmidt and Steve Carlton, and Tug McGraw makes an appearance.


1986 Mets: I was a high-schooler when this team made its appearance, and growing up outside NYC (even as a Yankees fan) there was no getting away from them. The 1969 team may have more sentimental value, but this is clearly the best team in franchise history, led by Gooden, Strawberry, and Carter.


1994 Expos: One of the great what-if teams, they were on their way to cruising to a division title and possibly more when the strike hit and wiped out the rest of the season. They had two hall of famers, but the team was dismantled after the strike and the team moved within 10 years.


NL Central


1975 Reds: The Big Red Machine is generally considered one of the dominant dynasties in baseball history, and this was their best year. Their pitching staff wasn't famous, but their batters included Hall-of-Famers Bench, Morgan, and Perez, and some argue Pete Rose should also be in the Hall of Fame.  I expect this team to do well.


2007 Rockies:  This team had an absolutely bananas stretch run, winning 14 of their last 15 games to clinch a tie for the Wild Card, then went on a winning streak that took them to the World Series (where they got swept by the Red Sox). The Wild Card game was a legit classic, even if it ended on a dubious call.  I honestly expect this team to do very poorly in this league, but it's just a gut feeling.


2013 Cardinals: The Cards have been in an extended period of success, with only a few years out of contention this century. The 2013 team has the best Pythagorean record by a little bit, and that's what I used to choose, but I could have gone with the 2004 or 1985 teams and not degraded team quality much if at all. The franchise seems to have a pattern of winning the World Series with mediocre teams (2006, 2011) and losing (usually to the Red Sox) when they have especially good teams (2013, 2004, 1985). Perhaps that's karma for 1946 and 1967. In any case, Pujols had moved on by this time, so it's a Beltran/Holliday team. 


2016 Cubs: Not only was this team famous for breaking the long World Series drought for the Cubs (as maybe you'd heard), but they also are certainly the best Cubs team since the 1930s and possibly since the previous time they'd won the World Series. It seems silly to mention the main players since this was so recent, but for completeness the team was led by Bryant, Rizzo, and Lester. 

Saturday, March 28, 2020

Cloverland Leagues: AL Southeast and AL West


On we go, counting down to Opening Day and moving (probably too slowly) though the divisions. So, I'll start doubling up...


AL Southeast Division:  I claimed in the last post the I thought the AL Central was a funny grouping, but really these are all funny groupings.


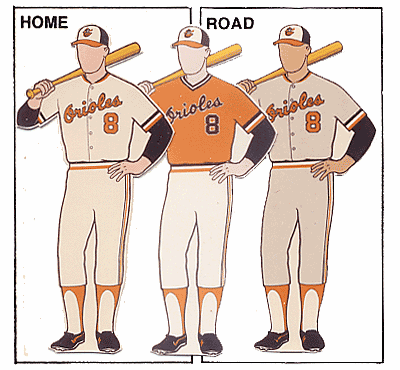
1973 Baltimore Orioles:  The very best Orioles teams were pre-DH, but this team from the very first year of the DH has many of the same players--Brooks Robinson, Boog Powell, and the pitching staff. This team also has a Pythagorean record just a bit better than the 1979 team, which was the other reasonable choice. The 1997 and 2014 teams, the best of the post-1979 years, don't come particularly close.


2010 Tampa Bay Rays: This division-winning team won 96 games, one less than the 2008 pennant winners, but had a better Pythagorean record. David Price shows up again for this team, and is probably the biggest star (other than maaaaaaaaaybe Evan Longoria?). I honestly don't think this team is going to do very well.


2011 Texas Rangers: The best team in franchise history both by real number of wins and by Pythagorean record, they had a heartbreaking finish in the World Series that year. Nelson Cruz seems to have shrugged it off, though.


2018 Houston Astros: Sandwiched between two pennant winners, it's this team that had the best Pythagorean record, which "should" have given them 109 wins on the year instead of "just" 103. One of the reasons this is a funny grouping is because I can kind of imagine how Tampa, Texas, and Houston might all do against each other--all are recent. I think Houston is clearly the best of those teams. But throw in Baltimore, and I have no idea. I think Baltimore is better, but I have no idea if it's because I've heard about those great Baltimore teams my entire sentient life and it's tough to believe that a team from two years ago can really compete?  I guess we'll see. And of course, there are no trash cans to help the Astros hitters here...


AL West Division:  So, this is an interesting division in that unlike the other AL divisions, all of these teams are spread in time from one another. That exacerbates the issue I just mentioned in that I have no idea how these teams will stack up against each other, though two of them are alums of the solo computer APBA leagues I ran in the past.


1977 Kansas City Royals:  The Royals, for instance. This franchise has been around for 50+ years, and has had their share of competitive teams--a mid-70s to mid-80s stretch that was consistent, and then a handful of mid-2010s teams. They won two World Series in that time, and appeared in two others. This team missed out on the World Series after the Yankees knocked them out of the playoffs, but was a great team--the greatest Royals team. How do they stack up against the greatest of other franchises?  I expect them to lose consistently.


1988 Oakland A's: Oakland has had several stretches of excellent play, with their best team (while in Oakland) coming just before the DH era. Their best team since 1973 is nearly as good, from the late '80s-early '90s dynasty. On paper, this looks like a dominant team.  In the APBA league, they regularly had trouble scoring runs and ended up a doormat. We'll see how this goes.


2001 Seattle Mariners: There is no other credible choice for best Mariners team of all time. The all-time record holder for most wins in a season for an AL team, plus the league as a whole would miss out if it had no Ichiro. I managed this team for APBA one year, which was a somewhat frustrating experience. I got them into 2nd place, but the 1995 Cleveland team was just too strong and we couldn't catch them. Again, I don't know how this will go. It could go well.


2014 Los Angeles Angels: I have no sense of what this team is about. I don't remember them as they were happening.  I also realize, as I'm writing this, that the 2002 World Series-winning team had a better Pythagorean (and real) record than this team, by a bit. Sorry about that, Angels fans. At least this way we get Mike Trout involved?


Thursday, March 26, 2020

Cloverland Leagues: AL Central


On we go to the AL Central. It's a bit of a funny grouping.


1982 Milwaukee Brewers: Harvey's Wallbangers! They won 95 games in real life, close to their Pythagorean projection of 96. The 1978-1983 period was really the only period of sustained success in franchise history. A couple of more recent teams (2011 and 2018) won 96 games, but had worse predicted records. Besides, when push comes to shove, how do you not go with these guys?


1984 Detroit Tigers: I wasn't quite old enough to be a baseball fan when the Big Red Machine was active, so this was the first team I remember that was touted as one of the all-time greats. And here it is. They outplayed their Pythagorean record by a few games, but are still pretty handily the best Tigers team of the past 50 years (but not the past 52). 


1994 Chicago White Sox: A strike victim, they were on a 96-win pace (with a 98-win Pythagorean projection) but of course got nothing. Frank Thomas had a monster year. I kind of feel like they're going to get killed in this league, but maybe not as badly as I feel like the Brewers will..


2019 Minnesota Twins: A 101-win team, and easily the best Pythagorean record of any Twins team since 1969, but damned if I could tell you anything about them (even though they're the most recent team in the league). The Yankees beat them in the playoffs, because of course the Yankees beat them in the playoffs. I suppose I'll learn more about them as the season goes on!


Wednesday, March 25, 2020

Cloverland Leagues: AL Northeast Division


So, I'm going to keep the Cloverland Leagues moniker, at least for now. As noted, I'm going to go through the teams and say a bit about each of them, starting with the AL's Northeast Division:


1998 New York Yankees:  Won 114 games during the regular season, which was an American League record to that point (the current record holder is in the AL West in this game), and went on to win the World Series. As a Yankees fan I'm rooting for them and will be managing them. At the time it was claimed that even though they were among the all-time greats they didn't have any Hall of Famers, but of course Jeter and Rivera proved that wrong.


2015 Toronto Blue Jays: Winners of only 93 games during the regular season, they scored and prevented runs at a clip that "should" have won them 101 games (i.e. their "Pythagorean record"). That's the best in Blue Jays history, and that's the metric we're using, so here they are. They also were involved in perhaps the single craziest inning I have ever seen in my 40+ years of baseball fandom. Josh Donaldson, Edwin Encarnacion, and Jose Bautista lead the hitters, and David Price makes his first appearance among the pitchers.  We'll see if they can keep out of 4th in this division.


2017 Cleveland Blues: I noted the name change in the last post. This team won 102 games in the regular season, but had an even better Pythagorean record (predicting 107.5 wins). This is another Edwin Encarnacion team--even given the sort-of compressed timeframe of this league I'm surprised at how many people show up on multiple "best-of" teams. Perhaps I'm used to the long tenures of the best recent Yankees? Or not acclimated to the late summer shuffle of good players from contending teams to non-contending ones?


2018 Boston Red Sox: Another recent team. This one is considered by a lot of folks to be not only the best Red Sox team of the last ~50 years, but the best of all time. In the old APBA game I used the 1912 Red Sox, it would be interesting to play them against one another (though perhaps hard to have a single group of game settings that could fairly apply to them both).  David Price makes his main appearance here, though I think he shows up on yet one other team. Mookie Betts was the superstar, of course...

Next up, we'll go to the AL Central.

Sunday, March 22, 2020

Social Distancing and New (Baseball) Beginnings


Well!  It's been quite some time since I've updated this blog, and what a decade the teens were, eh? Whoo. I never got terribly far with the last league--I didn't have time to really learn a new game and make it do what I wanted, so I used a quickstart that was available rather than trying to replicate the kind of leagues that I wrote about earlier in this blog's history.  Eventually that petered out, though I don't remember whether it was work and travel ramping up or if other things just took up my free time.

With the COVID-19 pandemic currently underway and affecting sports around the world, including the start (and perhaps the entirety) of the Major League Baseball season, I thought I'd give this another go. Technology has advanced, and while my free time is structured very differently than it was when I was last successful at running a league like this, I'm game to give it a go.

I'm using Out of the Park Baseball, the newly-released version 21. Rather than try to continue with what I was doing before, I'm basically rebooting. I'm using the best edition of each current team in the DH era, as determined by Pythagorean record (rather than real record). This is mostly for ease and so I don't have to deal with what's "fair" when the 1927 Yankees play the 1995 Indians (for instance). It turns out both the Astros and the Brewers have had their best seasons while in the AL, so the AL has 16 teams and the NL would have 14. To bring the NL up to a more aesthetic (to me) 16 teams, I've added the 1994 Expos (the Expos' move is the only relocation of the era) and a more fantastical choice, pretending that the Marlins moved to Charlotte in ~2006 or so and adding a "Charlotte Knights" team that's really the 2008 Marlins in different uniforms. They won't be competitive for the title or anything, so it shouldn't throw things off very much (I'm using a balanced schedule). It also seems like it'll be an interesting (perhaps only to me) experiment of how a not-great-but-decent team does when facing all-timers every day.

I did two other things of some (though perhaps little) note: I broke the DH-era rule for the Pirates and included the 1972 team. They're a bit better than any other Pirates team in the DH era, it's only off by a year, and that way Roberto Clemente can be included. Finally (I think), I rebranded the Cleveland team to be the Blues, one of the original names for the AL franchise. I figured since I objected to their current name (a feeling which has evolved over the decade this blog has been on hiatus) and I could do something about it, I would.

The next few posts will talk about the teams in each league. I certainly plan to have the time until that post be much less than the time taken from the previous test to this one. 

Tuesday, November 30, 2010

Game On?

I decided, after some deliberation, to move into the 21st century in terms of the baseball gaming.  Seriously.  I've been playing APBA Baseball for Windows, which has been fun but was a Windows 95 game.  I've dragged it around from our old Windows 95 machine to my rootin'-tootin' dual-bootin' Dell running Windows 2000, to Virtual PC running on my ol' PowerMac.  That was where the problems started, and it's only gotten worse since getting my MacBook Pro.  I'm not interested in installing Parallels or Boot Camp or whatever it is-- I managed to avoid a whole bunch of tsuris at work because I didn't have even a virtual Microsoft machine on here when they got hit with a major cyberattack.  So to play the game I'd have to either play on the old machine (which was already problematic) or, the lazy option I usually would pick, would use a VNC connection to the old machine and play it that way.  But I...well, I don't digress but I'm clearly going on too long.  The game isn't abandonware, but neither has an upgrade or new version been made since 1997, despite sporadic hope. 

So I've decided to try Out of The Park Baseball (OOTP).  I've been messing around for a few weeks, playing an All-Time All-Star League that was available on the web.  So far so good, I'll post about that soon.  I'm not exactly sure that I'll have a 1:1 correspondence with the games/simulations I was doing with the old game, but so it goes...

Sunday, January 24, 2010

Northeast Corridor

Recent and upcoming action centers on the Acela route. I mentioned Baltimore in the last post. The Boston Red Sox play-in is finished, and the 1948, 1949, 1995, and 2003 teams join the 12 Red Sox pennant winners in the qualification league, which I'll start... well, I'm not sure. Sometime soon? I'm still debating which team to manage, I'm leaning toward one of the Babe Ruth-era teams.

Over in the NL, I'm also setting up the Mets QL. Once again, should start soon. I'm less certain which team to manage here-- maybe 1969? Or maybe 1999. Finally, the Phillies QL is underway. At a bit over the 1/3 mark (I'm playing them to 180 games), the 1980 Phils are holding a 3.5 game lead over the 1978 team, with 1901 and 1976 another couple of games further back. I'm not sure who I was expecting, exactly. The teams with the best winning percentage in modern Phillies history are 1976 and 1977, the latter team is in 15th place (out of 16). The current dynasty of 2007-2009 are in 12th, 13th, and 14th. In case you're curious, Gene Mauch won't have to worry about a late choke in this league-- the 1964 Phils are deep in last place.

Sunday, January 17, 2010

Back in yon saddle (or '69, dude!)

Multiple crashes later...

We're back! We have a new router, which should work better. Home network has been messed with and is working better (knock knock knock). So I restarted up some of the leagues that have been so rudely interrupted:

For the Boston Braves, the previous state of affairs left the 1897 team well in front after 100 games. I ran through a replacement league and ended up with the 1897, 1898, and in a suprise, the 1948 teams all within a game of each other atop the league. So I ran it again. This time, as the first time, the 1897 Beaneaters held a healthy league at the end of things. So we welcome back the 1897 Beaneaters. As is the case in the Cloverland Leagues, the Beaneaters scored a ton of runs (6.5/game), but they had a league-average pitching staff this time, no mean feat when competing with dead-ball era squads like the Miracle Braves of 1914.

I also restarted the Red Sox Play-in League. At this point, I'm thinking I'll take four teams to add to the 12 teams with byes (the 12 pennant winners for the Red Sox). About halfway through, those four teams look to be 1949, 2003, 1995, and 1948.

Finally, after wrestling with the Orioles for so long, and all the crashes, I decided to just going to let the computer managers play it out. So congratulations to the 1969 Orioles, winners of 109 games (though they might have traded some of those for an extra three wins against the Mets). Here, they handily defeated their next closest rivals (from 1971 and 1970). In fact, the top four teams were all from Baltimore's early 70s dynasty, as 1973 finished fourth.

The '69ers were second in the league in runs scored (half a run per game above average), and first in ERA (0.7 of a run better than average). Jim Palmer '71 had 27 wins, and Mike Cuellar '69 led in strikeouts. On the hitting side, Eddie Murray '83 led in batting, Boog Powell '69 and Frank Robinson '66 tied for the lead with 44 home runs, with Boog's 1964 version just behind with 43.

Next up? Continuing the Red Sox play-in, and I think I'll try the Phillies. I'm pretty clearly not going to get Season 4 started before the real season begins, but that's OK. It is, after all, supposed to be fun, not work. :)

Sunday, November 22, 2009

On the Backstretch

Well, maybe that's not quite accurate. But a bit more than 90 games are done in the Orioles League, with about 60 to go. The current standings:

Team W L GB
1979 52 34 -
1969 53 38 3.5
1971 49 39 6
1997 49 40 6.5

with the other teams trailing further, all the way to the 1980 club, 21 games back. My 1966'ers have been very hot and cold, following up a 7 game win streak by losing 9 of 10 (and counting!)...
Various Boog Powells and Frank Robinsons are leading the league in the important categories. The big shock (for me) is the 1970 team languishing below .500 and probably out of the running.

As far as the Red Sox Play-in League, the top four teams will make it to the next stage. At this point, those four teams look to be the 2003, 1999, 1949, and 1972 clubs. 1977 and 1995 aren't far behind, though. 1972 was not a particularly distinguished year for the Sox (2nd place, a half-game back in a strike-shortened year in circumstances that, frankly, I don't understand), and I might expect them to drop out of the running.

Saturday, November 07, 2009

Red Sox Play-In, and Orioles Update

First! Started the Red Sox Play-In league. I've already forgotten whether I was going to take 2 or 4 teams, but that's an issue for a later date. The teams, as noted elsewhere, include the near-misses of the pre-Wild Card era (1948, 1949, 1972, 1977, 1978), most of the teams that made the playoffs but not the pennant (1988, 1990, 1995, 1999, 2003, 2005, 2008, 2009), and the only other team that finished over .600 and in 2nd place (1942). 10% of the way through, and the 1999 and 1949 teams are tied at the top.

Second! The Orioles League crept forward. The 1979'ers have a 1 game lead over the 1971 team, with 1997 and 1969 a half-game further back. The season's roughly half over.

Third! Rethinking the Rockies. The 2009 team was a good one, almost certainly at the same level as the 2007 team currently slated for inclusion. So, I'm thinking I'll run them against each other.

Friday, November 06, 2009

Where were we?

Let's see. Now that I'm probably done recording music for a little while, and crazy summer travel has slackened, and the Yankees have finished off the real season in style :) , it may be time to reconnect with stuff here. Having lost the Orioles season to the crash was something of a bummer, though, and has clearly sapped my enthusiasm for actually playing that season and managing a team. I'm now leaning toward just letting the computer finish it and moving on. In theory, I was also thinking of playing a Red Sox season and managing a team. We'll see how that goes.

Wednesday, July 29, 2009

Crash and crash

Lost the Orioles season to a crash. Restarted it and ran it on auto to get to the point where it was before. Again, another crash. Worst of all, it was my own stupidity that led to the crashes. :P

I'm going to try and pick this up again. Oddly (or perhaps as one might expect?) the third time through has tracked the original pretty well: 1969 a bit ahead of 1979, 1966 near .500. The details don't match, though. (The second time through 1969 was running away with it.)

So the question is whether to pick up and start managing where it left off (probably) or just let the computer managers finished what they started and move on (probably not). Unfortunately, I've been so swamped with things, I haven't had much time to play anyhow...

Monday, June 08, 2009

Baltimore, Boston, and Boston

Lumbering along. The Orioles league is approaching the halfway mark, with the 1969 team still holding a narrow lead over the 1979ers. Three other teams are lurking a bit further back. My 1966 squad has been playing much better, and slowly has entrenched themselves above .500.

Meanwhile, the Boston Braves Qualification League is underway. This is almost certainly a battle to be won by one of the 19th century teams; the franchise had a dynasty just before the 20th century dawned, and was almost completely inept from 1900 on. The 1897 Beaneaters, winners of the 2nd Cloverland Series, are in the lead with 1893 in second place.

After the Braves finish, I'm considering a Red Sox league. There are a great many teams worthy of consideration as best of the bunch, so I'm setting aside a bye for the 12 pennant winners they've had (from 1903-2007). The league I'm considering playing with next would be a play-in league, to select another 2 (4?) teams to join those 12. The play-in league would draw from the near-great Red Sox teams, from those that lost in a one-game playoff (1948, 1978) or just missed the playoffs (1949, 1977, 1972) to those that made the playoffs and lost in an opening round (1995, 1999, 2003, 1990...). If not these guys, I may choose to play a White Sox or Indians league.

Sunday, May 10, 2009

Twin Cities Closure

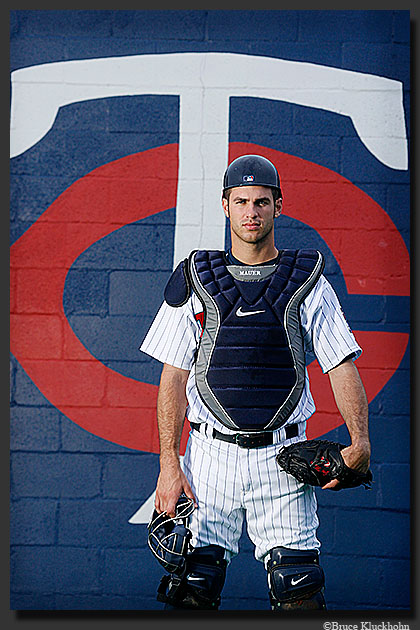
The real season has begun, and progress in the virtual leagues has been slow.  However! I have finished the Twins Qualification League and am happy to present the champions: The 2006 Minnesota Twins.  American League Central champions and winners of 96 games in real life, the 2006 team held off a late charge by the 1969 Twinkies to take the title by 3.5 games.  They were powered, as you might expect, by Johann Santana (22-5, 1.94 ERA, 250+ Ks), Joe Mauer (.385 to lead the league plus 121 RBI) and Justin Morneau (.330, 35 HR).  Harmon Killebrew had a monster year for both the 1967 and 1969 teams, but it wasn't enough.
Meanwhile, a couple of weeks of game time have passed in the Orioles League. My 1966ers have scuffled a bit and still sit a bit below .500.  The 1969 Os are 1.5 games ahead of the 1979 edition, with 1970 in 3rd.

Friday, February 06, 2009

Spirit of '69

Another two weeks of game time have passed in Baltimore, and we're past the quarter pole. The 1969 Orioles have ripped off 9 wins in a row to roar into first place, leading the 1979 team by 1.5 and 1970 by 3. My team, the 1966 Orioles, have been more or less treading water and sit at 20-22 (8 games behind).

Milt Pappas (who could forget Milt Pappas for Frank Robinson?) from the '64 edition is at a sparkling 8-2, with a surprising 1.17 ERA. My boys from '66 are making a good show of the hitting leader boards, however, with folk hero Russ Snyder batting .375 and Frank Robinson (see, you how could you forget?) leading the league with 15 home runs and 41 RBI.

Up in the Twin Cities, we're over halfway home. And here, too, the 1969ers are putting on a run. However, they have not (yet?) pulled ahead, finding themselves 1 game behind the 2004 team (with 2006 another 1.5 games back). Joe Mauer of the 2006 Twins paces the league with a very impressive .392 average, also leading in RBI. Meanwhile, Harmon Killebrew is tied with himself for the home run lead, and is also sitting a little bit further behind in third. Rafael Santana (2006) is at 14-2 with an ERA just under 2.00.

Looking ahead somewhat, the Boston Beaneaters/Braves or the San Francisco Giants will probably be the next team up after the Twinkies finish.

Saturday, January 17, 2009

Twins and Orioles update


The Twins League is roughly one-quarter done.  The 2003 team leads a bunched field, riding a 5-game winning streak with the 2004 team percentage points back and 2006 1.5 games behind. Based on the team stats, the 2006ers are looking pretty strong despite their current residence in 3rd.  Rod Carew (1967) leads the league in batting at .395, Killebrew (1967) in home runs, Brad Radke (2004) is at 6-0.

Meanwhile, up in Charm City, the 1979 Orioles are a game up on the 1970 team after 30 games, with the 1969 and 1997 teams in the next rank a few games back.  Surprisingly, the pitching for the 1970ers is underperforming, otherwise they'd be running away with things.  Mike Mussina (1997) is 6-0 with an ERA of 1.39, with Robby Alomar (1997) hitting .355.  Three players are tied for the lead in home runs.  My 1966 team is languishing in 9th (of 14), 5.5 back.  Of course, who knows how they'd be doing if not for my managing....

Saturday, December 27, 2008

Minnesota New Day Rising

The Twins League is underway (though perhaps with a Prince soundtrack rather than the Posies song quoted in the title).  Ten teams, basically in three time periods: the Killebrew era when the Twins had very good teams that couldn't quite beat better teams (like the Koufax Dodgers or the '69-'70 Orioles); the Puckett era when the Twins had decent teams with unbeatable home field advantage and regularly defeated better teams (Whitey Herzog nods sadly); the Johan Santana teams of recent vintage who mostly couldn't quite get out of the first round of the playoffs.

The 1970 team are the current representatives in the Cloverland Leagues.   About 20 games in out of 162, it's too close to call and far, far too early.  I guess I'd bet on 1965 as the best of these teams, but that doesn't always translate into success.  Still, if I have to guess a winner...

Meanwhile, the 1970 Orioles still are the leaders after roughly 25 games, but the 1979 edition has been on a tear and have closed to a half-game back.  Again way too early for real prognostication, but it may end up closer than I'd expected...

Monday, December 22, 2008

And from the Polo Grounds...

After a pretty close race, the 1911 New York Giants fought off the 1912, 1913, 1904, and 1905 editions of the 'Jints to win their qualification league and represent the New York Giants franchise.

The final standings at the top:

W L Pct. GB
1911 89 60 .597 -
1913 88 64 .579 2.5
1904 87 65 .572 3.5
1912 87 65 .572 3.5

Despite winning the World Series in a 4-game sweep, the 1954 Giants finished in 20th (that'd be last), 28.5 games back.

The hitting categories were mostly led by teams from the 1920s and 1930s, as one might expect, save for Jack Doyle of the 1894 squad sitting atop the batting average and obp categories and  just missing a .400 season (.399).  Mel Ott (1934) led in slugging and runs created, Rogers Hornsby (1927) in runs scored, George Kelly (1922) in RBI, and Bobby Thomson (1951) hit 33 shots heard 'round Kings Contrivance to edge out Ott (1936) and lead in home runs.

Pitching statistics were biased by the 1894 team, who had two pitchers starting 70%+ of their games in real life.  Those two pitchers (Amos Rusie and Jouett Meekin) both topped 30 wins.  Hall of Famer Christy Mathewson took up 4 slots in the top 10 winners and top 10 ERA, with the 1905 edition performing best: 29-10 (3rd in wins, 2nd in win pct., 1st in ERA, 4th in strikeouts).  

The 1911 team didn't have many statistical leaders, but managed to grind out the pennant by being among the team leaders in batting and pitching.  In reality they lost the World Series to the Philadelphia Athletics.  

The Orioles league has stalled out a bit (naturally, since I'm actually trying to manage one of the teams instead of letting the computer do all the work).  Not sure if the next all-computer league will be Oakland or Minnesota...

Tuesday, December 02, 2008

Giants after 90, Orioles after 20

The decision of who will right to represent the New York Giants is currently looking like it'll go down to the end. A bit over 90 games are finished, with roughly 60 to go. Five of the 20 teams are within a half-game of the top:

Team W L Pct. GB
1913 52 38 .578 -
1904 53 39 .576 -
1922 53 39 .576 -
1905 52 39 .571 0.5
1912 52 39 .571 0.5

Meanwhile, in Charm City things are a bit more separated, though it's still early:
Team W L Pct. GB
1970 15 5 .750 -
1969 12 6 .667 2.0
1960 12 7 .632 2.5
1997 10 7 .588 3.5

It seems unlikely the 1970 team will be able to keep up that pace, but there's nothing weird about them being atop the standings...

Sunday, November 23, 2008

Giant Steps

About 40% of the way through for the New York Giants league. The dead ball era teams continue their dominance, with the 1904 club leading the pack followed by the 1911, 1905, and 1912 teams all within 2 games.

Jack Doyle of the 1894 team is pacing the league with a remarkable (and way over his head) .457 average. Bill Terry's excellent .407 is second but obviously overshadowed. Bobby Thomson and Mel Ott are leading in home runs.

Christy Mathewson of various vintages is filling the pitching leaderboards, with the 1905 version at 12-1 and the 1913 version leading in ERA with 1.37.

Saturday, September 13, 2008

O's and Jints Update

Just a short one for now. The Orioles League has gotten through about two weeks of play, and the 1970 team is in the lead at a blistering 10-1. My 1966ers were barely a speed bump in their way, though they did force late inning heroics by Paul Blair of 1970 at least once. There's a bit of a bunch up behind the leaders and needless to say it's early yet.

I've gotten a bit further for the New York Giants QL. There the 1904 and 1905 teams lead the pack. Again, it's early yet. But I'll note that the current Cloverland League representatives are the 1970 Orioles and the 1905 Giants. It's rare for teams to be able to defend their places, with only the 1906 Cubs, 1927 Yankees, and 1976 Reds having done so so far (and I punted the Yanks for the 1939 edition in part just to do something different and since they'd finished "close enough"...).

Saturday, August 30, 2008

Dog Days

Alas, the playoff hopes of my real-life favorites are quickly dimming. I also have been too swamped to get too much done in the APBA leagues. I've started the Orioles QL, managing the 1966 edition. I'll post an update on that league once I've gotten through 10 games (right now it's at 7). I haven't started up the NY Giants at all.

But I figured I'd mark the Rays' clinching of a winning season by officially bumping the 1937 Santo Dominigo Dragones in their favor. With 83 wins and 28 games to play, it seems likely they'll reach 90 wins with no trouble and a .500 record would net them 97. While having the Dragones meant including Satchel Paige, Josh Gibson and other greats in the Cloverland Leagues fun, my general philosophy for the simulation means I should include the team that I have a hope of including at their real relative strength instead of the one with kludged stats. The only real kind of debate would be whether holding off on Tampa Bay until Season 5 might allow a better TB team to be represented, but I can always have a runoff or something if it ends up being useful. But for now, congratulations to Scott Kazmir, Evan Longoria, Carlos Peña and the rest.

The Brewers present another problem. If the 2008 team is worthy, they could either be stuck in the AL as a non-DH team (since the majority of their seasons were as an AL franchise) or included in the NL (since they would have had this season as an NL team) with the AL version removed, or (gulp) treated as separate teams and included twice (though I don't like that option at all). If treated as an NL team, that would bump the 1896 Orioles and open space in the AL for... well, I guess the Dragones again.

Tuesday, August 05, 2008

National Heroes

The Washington Nationals Qual League (that'd be the version of the team that moved to Minnesota in 1961) has finished. The 1924 and 1930 teams battled most of the season, with the World Champs opening up a slender lead in the closing weeks...

And then losing it at the very end. As with the Pirates, there were 3-4 rainout makeups to close the season, and it was over the course of those games that the 1930 edition overtook the 1924 team.

The 1930 Nationals finished 2nd in real life to the equally-defunct Philadelphia Athletics, also represented in the Cloverland Leagues. They join a surprising number of 2nd-place teams in a league that ostensibly has the best of each franchise. However, they had the 3rd-most wins in Washington history and the best Pythagorean record of any Washington team, so this result doesn't strain credulity. They were led by Hall of Famer Sam Rice and also had Hall of Famers Joe Cronin and Heinie Manush, trading away HoFer Goose Goslin early in the season. Fittingly for a team managed by Walter Johnson, however, their team strength was pitching. Ironically, in the Qualification League, the 1930 team won via their bats.

Next up: The New York Giants and actually starting the Baltimore Orioles QL.

Sunday, July 13, 2008

A Surprise in Steel City

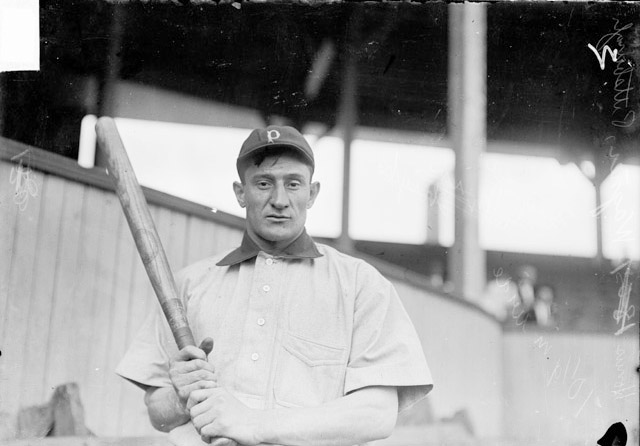
It came down to the last day, but the 1960 Pittsburgh Pirates will be moving on to Season 4. They finished hot, winning 2/3 of their last 50 games while the 1901 edition played merely OK (.550 over their last 50 games, only about .500 in their last 35). The end of the season saw a slew of rainout make-ups, and the 1960 team finished early, one behind in the loss column but one ahead in wins. Needing to win one game to clinch a tie, the 1901 team instead dropped both of their last make-ups...

So for the first time since I began, Pittsburgh will be represented by a group other than Honus Wagner, Fred Clarke, and their dynasty of the aughts. Given their status as reigning NL East champions, this is also something of a shock. Instead it'll be Roberto Clemente, Vern Law (20-5 in the QL), and Bill Mazeroski.

The Washington Nationals (AL) Qualification League has begun play, with 8 teams from 1912 to 1945. I might put my money on the 1933 team, though the current representatives from 1925 are also a relatively safe bet. Meanwhile, given the play of Tampa Bay and Milwaukee in real life, the odds of an alteration to current expansion plans is certainly a going concern...

Friday, July 11, 2008

50 More Games Gone...

The top of the Pirates League remains the same, though there's been some mixing below that upper crust. The 1901 team still leads, winning at a .646 clip. Bonds and the 1991 Pirates have dropped off the pace from 2nd to 3rd, while the 1960 Pirates are hanging in there, merely 4 games back. Meanwhile, the 1970 team has dropped 2/3 of their games since the last update and now sits in last place, with the 1975 and 1972 teams joining them in freefall. Meanwhile, the 1893 edition has picked up the pace as their best pitchers have been taking the mound more often.

Fred Clarke of 1903 continues to blister the ball, batting .380, but has fallen to 3rd in batting behind 1901's Ginger Beaumont and 1927's Paul Waner, who's up at .407. We'll see if he keeps it up all season. Willie Stargell from 1971 now has the HR lead by himself (25), with two other Stargells, Robertson, and Dr. Strangeglove Dick Stuart rounding out the top 5. Fred Killen of 1893 has 17 wins and leads the league in strikeouts, while Jesse Tannehill from 1902 leads in ERA (1.91).

I'd have to think the 1901 squad would continue their pace and make it to Season 4. The 1960 Pirates were good, but not _that_ good. On the other hand, they only need to get lucky...

Friday, June 27, 2008

50 Games Gone in the Steel City

Eighteen teams are vying to represent the Pirates franchise during Season 4. I've gotten through 50 games (out of 136, IIRC). To update all my loyal followers, here's what the top of the standings looks like:

Team W L Pct. GB
1901 35 14 .714 -
1991 32 18 .640 3.5
1960 30 19 .612 5
1909 29 21 .580 6.5
1902 28 22 .560 7.5
1972 26 24 .520 9.5
1975 26 24 .520 9.5
1970 25 25 .500 10.5

I was expecting the 1902 team to be the winners, there's still plenty of time left. The 1991 team is certainly hanging in there, though...

In terms of individual leaders, Fred Clarke of 1903 is leading with a .392 average, Bob Robertson from 1970 and Willie Stargell from 1971 both have 12 home runs, and Jake Beckley form 1893 has 56 RBI. On the pitching side, Vern Law and Bob Friend of the 1960 team and Deacon Phillipe from 1901 all have 8 wins. Ed Brandt from 1938 has an ERA of 1.13 (though he's unlikely to get enough innings over the whole season to qualify), and 1902's Jack Chesbro leads with 60 strikeouts.

Sunday, June 15, 2008

Royals Treatment and Incoming Pirates

Congratulations to the 1977 Kansas City Royals, which will (eventually) represent the franchise in Season 4 of the Cloverland Leagues. They ended up crushing their rivals in a four-team league, going 100-56 and 24.5 games ahead of the second-place 1978 edition.

Next up: A truly massive 18-team Pittsburgh Pirates QL. The participants range from an 1893 team that featured Connie Mack as a player, through the Honus Wagner years, Roberto Clemente, and Willie Stargell years all the way down to teams with a young Barry Bonds. My guess is that the 1902 team, current NL East champions, will take it and return for Season 4.

I also may start trying to get the Baltimore Orioles QL underway. I plan to manage one of those teams, though, and I'm having a hard time picking...

Sunday, June 01, 2008

Photo Finish (and a reshoot)

The Royals Qualification League reached a finish, with the top three teams extremely tightly bunched:

W L Pct. GB
KC 1978 92 70 .568 -
KC 1976 91 71 .562 1
KC 1977 91 71 .562 1

The three teams were also closely matched to one another, within 2 games of .500 over 36 games played. Statistically, they were also very close in ERA and fielding, though the 1977 team scored significantly more runs than their rivals... They also were much better in real life.

So, I figured I'd run it all again, this time with just those three teams and the incumbent 1985 team, which finished fifth (though only a half-game out of fourth). I'm roughly halfway through there, and they're not bunched. So I'm confident there will be a clear-cut Best Royals Team. :)

Sunday, May 18, 2008

KC Update

Things have been poking along slowly around the Pleasure Grounds, but the Royals Qualification League has slowly been moving forward. With about 6 weeks of game time to go, the top of the standings look like:

Team W L Pct. GB
KC 1977 73 55 .570 -
KC 1976 71 54 .568 .5
KC 1978 72 55 .567 .5
KC 1985 70 55 .560 1.5
KC 1984 65 64 .504 8.5

The 1980 team is further back, but it at least seems clear that the mid-late 70s teams were the best in Royals history. Not that this is a surprise.

Saturday, April 05, 2008

Good Morning Baltimore!

I'm going to run most of the qualification leagues with all computer managers, which'll speed things up. But for two of the leagues I'm interested enough to actually manage one team for myself: the Red Sox and the Orioles. Since the local boys aren't going to threaten this year, it seems safe enough to do them first (I'd just as soon hold off on Boston since there's the chance the 2008 team will be the "best-ever" team, though i dearly hope they're not).

I've got 14 teams lined up for the Orioles League, split into two divisions: 6 in the pre-DH division, 8 in the DH division. As with the other QLs, there are basically three types of teams: pennant winners/playoff teams, close misses, and good teams that may or may not have come _that_ close but represent an otherwise absent era. The Orioles were excellent for most of the 70s and early 80s, with a brief late 90s renaissance. In addition, there are 4 teams included from the 1960s-- the 1969 team (famous for losing to the Mets), the 1966 World Series winners, and two near-miss teams, 1960 and 1964. I left out the 1996 wild-card winners since they clearly don't match up and (perhaps more to the point), it'd be a _lot_ more work to include them than other teams since I'd have to enter all their players in by hand.

I haven't totally decided, but I'm leaning toward managing either the 1966 or 1979 teams.

In other QL news, at about the 1/3 mark, the 1985 Royals hold a slim lead over the 1980 team, with 1978 and 1977 close behind. The 1985 Royals are the current Cloverland League representative.

Thursday, April 03, 2008

Season Zero

While I've played a few seasons now with Baseball for Windows (ironically using Virtual PC on my Apple), the very first season was with a Strat-O-Matic card set. I've been thinking of it as Season Zero.

I started it not long after the 1981 baseball strike, when I bought my Strat-O-Matic set. The setup seemed reasonable to me, 11-year-old that I was when I started: use the original 16 teams and play out a season. Unfortunately, given the limitations of the available card sets (and my losing track), I ended up with the Milwaukee Braves instead of the Boston Braves. I also had to settle for the 1940 Reds and the 1950 Phillies instead of the Big Red Machine or the 1980 Philadelphia World Series winners...

I set up an 84-game schedule, and I kept stats by hand. It took years, but luckily I didn't have much of a life (I was, after all, 11-14). I also didn't necessarily follow all the rules: I was too lazy to reshuffle the 40-card deck after every draw, which I'd do for a truly random number. So that got a bit biased. I also didn't necessarily use the "right" lineups, and I'd often turn a good part-time hitter into a full-timer (Fred McNeely, '24 Nationals-- I'm looking at you). But eventually I got through it all.

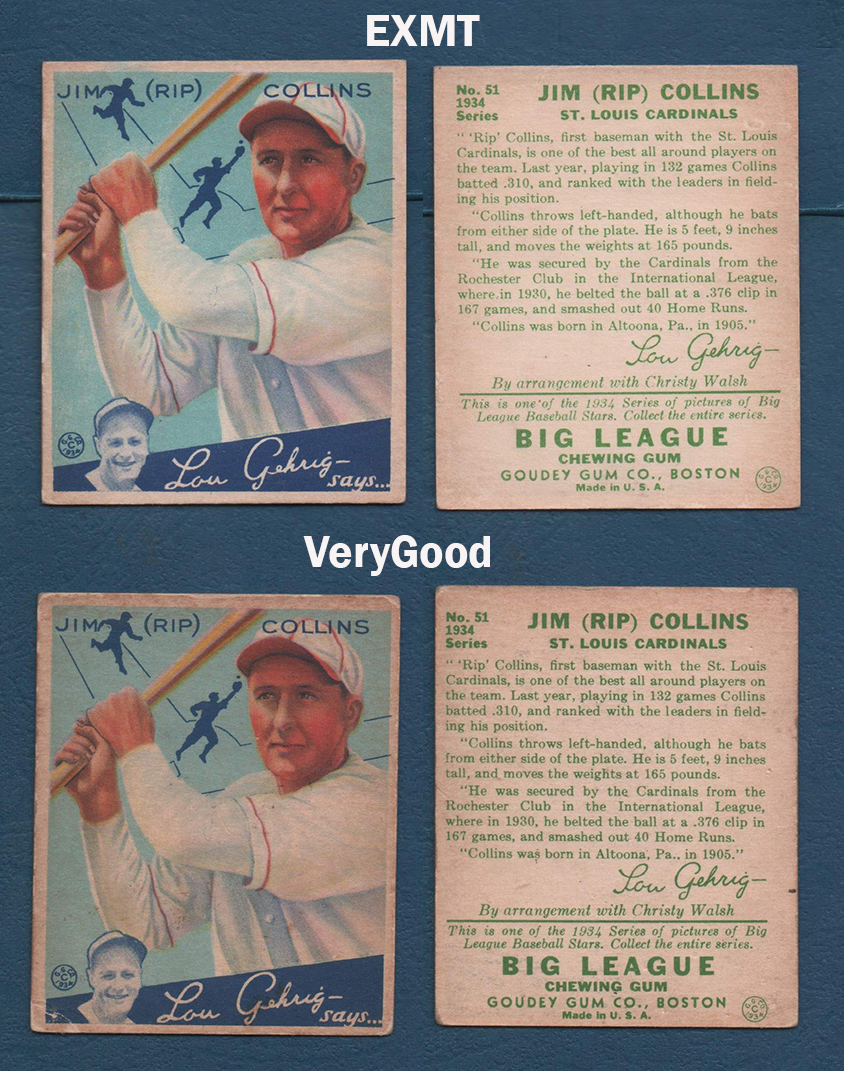
The '27 Yankees ran away with the American League, leaving the '31 A's in the dust. The '53 Brooklyn Dodgers tussled with those underdog Reds and Phils all season, finally pulling it out by one game over Cincinnati and two over Philadelphia. The Yanks defeated Brooklyn in six games. Lou Gehrig was the MVP for the AL. I don't remember the NL winner, Rip Collins of the '34 Cardinals, perhaps?

These teams and this setup provided the basis for Season 1, though with the software I was able to substitute in a Boston Braves team and also get the Big Red Machine and... well, whatever you'd call the 1980 Phillies.